
The investment community lost one of its more colorful characters two weeks ago with the passing of Martin F. Zweig, a prominent market pundit, author, and chairman of Zweig-DiMenna Associates LLC, a New York investment firm. His death at age 70 also marks the close of another chapter in the long-running debate on the virtues of market timing.
Zweig predicted the Dow’s October 1987 one-day crash of 29.2%.
Zweig, who earned a PhD in finance from Michigan State University, began writing investment newsletters while teaching in New York. He also wrote numerous articles for the weekly investment publication Barron’s and favored statistical measures of monetary policy, investor sentiment, and market momentum in managing portfolios.
His finest hour, or perhaps his luckiest, turned out to be an appearance on the television show Wall Street Week with Louis Rukeyser on Friday evening, October 16, 1987. When his host asked him to comment on assertions from other market commentators that the “bull market is dead,” Zweig replied he was expecting a crash but was reluctant to say so publicly. It was too similar, he said, to shouting “fire” in a crowded theater. Zweig’s prediction proved eerily accurate: The Dow Jones Industrial Average fell by a staggering 29.2% in chaotic trading the following Monday, an even bigger setback than the combined losses from Black Monday and Black Tuesday in October 1929.
The same October day the Dow dumped 29.2%, Zweig Fund lost only 6.2%.
His closed-end mutual fund, which had adjusted its exposure to stock and bond technical indicators, emerged relatively unscathed. According to a profile several years later in SmartMoney, the fund had 58% of its assets in cash leading up to the crash, which enabled the 6.2% loss on October 19. Traumatized by the unprecedented market break, many investors sought advisors or analysts who appeared to have avoided the debacle. Zweig’s reputation as a financial expert soared overnight, and his stellar reputation persisted well beyond. The headline of his obituary in the Wall Street Journal described him as a “master market timer.”
Should you seek to enhance your returns by market timing?
The evidence is mixed at best. Zweig’s October 1987 market call was on the money, and the Hulbert Financial Digest once reported that The Zweig Forecast ranked first among market newsletters for risk-adjusted performance. Many investors have discovered, however, that making one or two great predictions is usually insufficient to generate above-average long run results. Particularly after the costs involved in executing the back-and-forth trades, you have to be right over and over again to outperform a targeted, consistent strategy.
Zweig’s long-term track record: not so good.
Annualized return for the Zweig Fund from inception in October 1986 through January 31, 2013, was 5.84% based on NYSE closing share prices. Over this same time period, the annualized return for a static mix allocated 30% to the S&P 500 Index and 70% to the Barclays Aggregate Bond Index was 8.18%, an outperformance of more than 2%. This comparison is not quite fair, as indexes do not include index fund management fees and Zweig’s fund performance does. However, we can assume that including those index fund fees would still leave some outperformance versus the Zweig fund. Currently the Zweig fund has expenses of 1.13% reflected in performance, whereas broadly diversified index and passively managed stock and bond funds typically have expenses of less than 0.2%.
Simple can be better.
Market timers often acknowledge that their signals do not provide sufficient guidance to outperform a buy-and-hold, 100% stock strategy. Their goal, they say, is to avoid major bear market losses by switching to a high allocation to bonds during market downturns, and to capture a meaningful portion of equity market rewards by increasing stock holdings during the upswing.
The 30% stock /70% bond index portfolio example shows that the goal of reducing market losses can also be effectively pursued with greater simplicity by adopting a lower stock exposure at all times and eliminating the monetary costs and emotional frustrations associated with constant fiddling. One dollar grows to $7.92 which equates to the 8.18% annualized return (versus annualized returns of 7.07% and 9.84% for the Aggregate Bond Index and S&P 500 Index, respectively). The vertical axis shows log values of the indexes, which enables a better comparison of the percentage changes throughout the timespan as well as during the stock market crash of October 1987.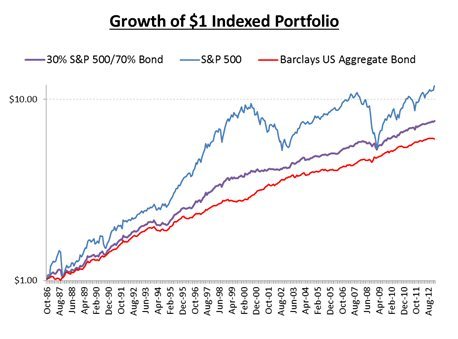
Zweig worked diligently and enthusiastically to tease out tomorrow’s stock prices from today’s data. But before applying the technical indicators for which he advocated to your portfolio, ask yourself whether favorable results are due to skill or luck. That is tough to answer honestly – too tough, we would say, to stake your life savings on being right or wrong. We favor the patient approach.
“Our stay-put behavior reflects our view that the stock market serves as a relocation center at which money is moved from the active to the patient.”
— Warren Buffett’s 1991 letter to Berkshire Hathaway shareholders
Adapted with permission from Weston Wellington’s “He Called the Crash.” Dimensional Fund Advisors.
[Photo credit of mosaic at NYC subway stop: Flickr user epicharmus]
REFERENCES
Stephen Miller, “Master Market Timer Had Front Row Seat,” Wall Street Journal, February 19, 2013.
William Yardley, “Martin Zweig, Who Forecast ’87 Market Crash, Dies at 70,” New York Times, February 22, 2013.
Zweig Fund performance data, www.virtus.com, accessed February 22, 2013.
Zweig Fund expense data, http://www.nyse.com/listed/zf.html, accessed March 5, 2013.
John Anderson, “Running on Empty,” SmartMoney, September 1995.
Dow Jones data provided by Dow Jones Indexes, S&P data provided by Standard and Poor’s Index Services Group, Barclays data provided by Barclays Bank PLC. Sample 30% S&P 500 index / 70% Barclays Aggregate Bond portfolio rebalanced annually.
This blog entry is distributed for educational purposes and should not be considered investment, financial, or tax advice. Investment decisions should be based on your personal financial situation. Statements of future expectations, estimates or projections, and other forward-looking statements are based on available information believed to be reliable, but the accuracy of such information cannot be guaranteed. These statements are based on assumptions that may involve known and unknown risks and uncertainties. Past performance is not indicative of future results and no representation is made that any stated results will be replicated. Indexes are not available for direct investment. Their performance does not reflect the expenses associated with the management of an actual portfolio.
Links to third-party websites are provided as a convenience and do not imply an affiliation, endorsement, approval, verification or monitoring by Granite Hill Capital Management, LLC of any information contained therein. The terms, conditions and privacy policy of linked third-party sites may differ from those of this website.
 / 403(b): Don’t Make Fund Allocations Equal")

")