
We’ve long felt that the only value of stock forecasters is to make fortune tellers look good. … I believe that short-term market forecasts are poison and should be kept locked up in a safe place, away from children and also from grown-ups who behave in the market like children.” – Warren Buffett’s 1992 letter to Berkshire Hathaway shareholders
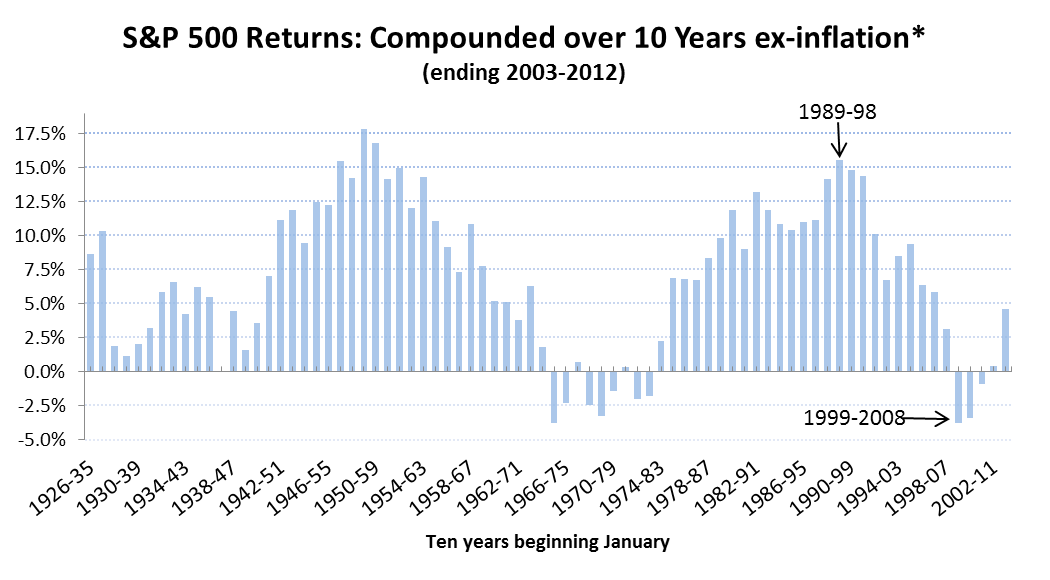
One of the least certain variables in accumulating funds for retirement is the long-term return from stocks, both capital growth and income. The impact can be huge. Consider US stocks from 1989 to 1998. As represented by the S&P 500 index, they compounded at a rate of +15.6% in real, purchasing power terms (excluding inflation). A $100,000 investment ballooned into almost $479,000 at the end of ten years (with dividends reinvested ignoring tax, transaction, and holding costs). In contrast, compounded returns for the period 1999 to 2008 were -3.8%. A $100,000 investment dissolved into a little more than $67,800 in real purchasing power terms at the end of ten years. The graph below reveals this variation in annualized return rates over 10-year periods since 1926.
What long-term return should you expect from US stocks? There is no universal consensus on the absolute best method of calculating probable or “expected” performance. To name a few of the more commonly used methods, there’s historical average, the dividend discount model (known among nerds like me as the Gordon model), and the Shiller Price/Earning calculation.
For today’s purpose, we’ll explore the calculations that come from the approach popularized by Robert Shiller, economist and author of “Irrational Exuberance” among other books. The Shiller PE indicates expected real returns of about +4.5% over the next ten years; however, it also makes clear that they could be significantly higher or lower.
Long-term predictive power of Shiller PE. In the graph below, real returns in the ten years following the peaks in 1929, 1966, and 1999 are negative, as shown in red. High returns follow the troughs in 1949 and 1982, as shown in green.
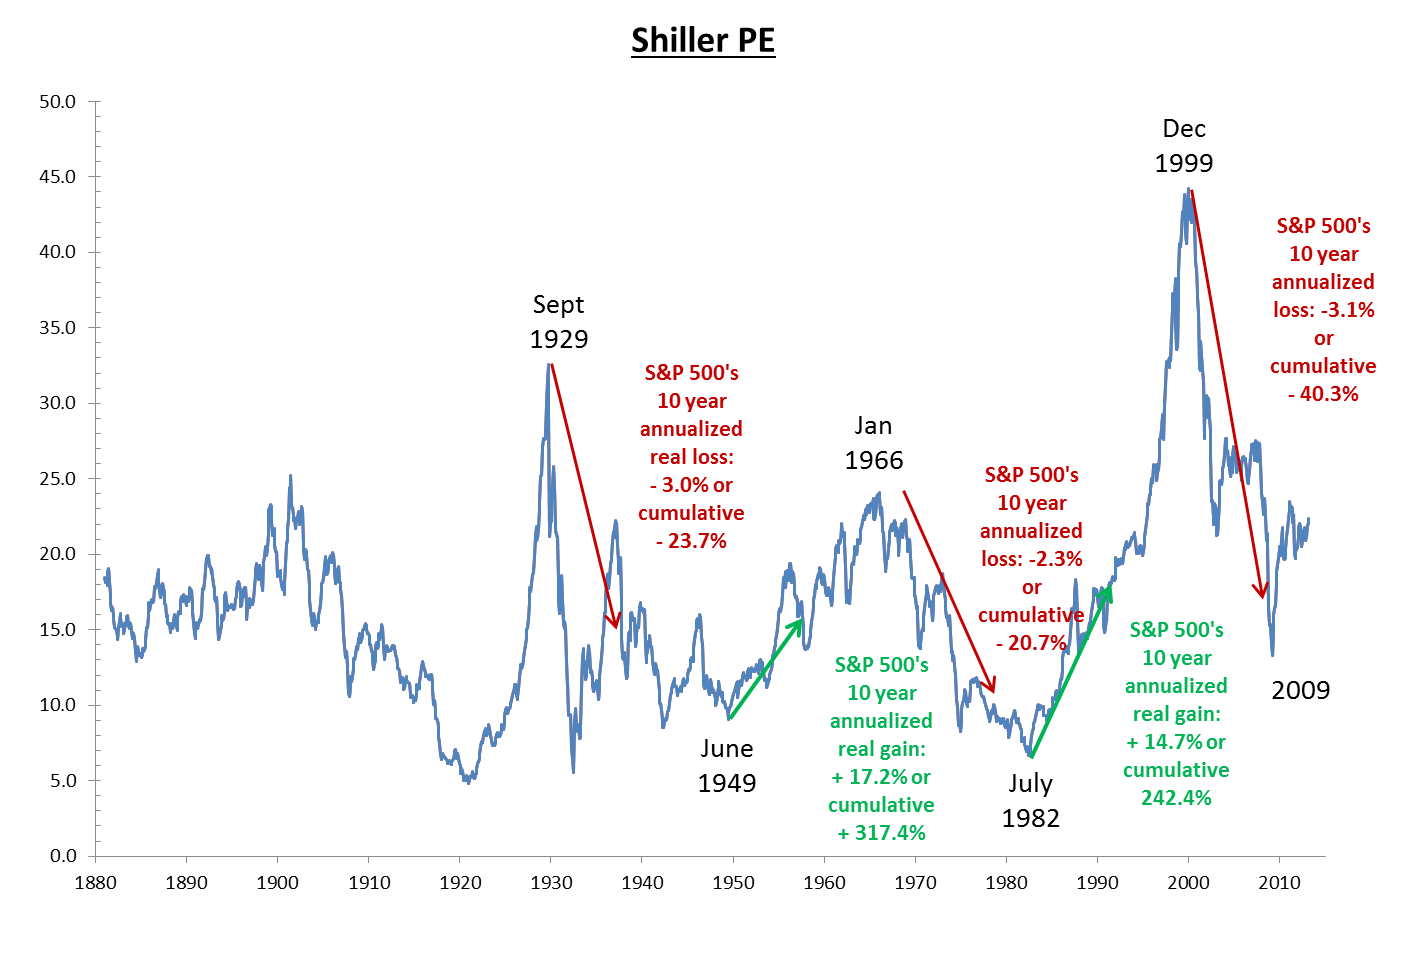
Sources: ONLINE DATA ROBERT SHILLER, Granite Hill Capital calculations.
Predictive power not so precise. Cherry-picking tops and bottoms with the benefit of hindsight is one thing. However, looking at the data more broadly will remedy such overconfidence. The graph below shows returns from the first bar graph on the right side. They are matched to Shiller PE’s on January 1 of each year from 1926 onwards (horizontal axis below) and result in the graph’s blue diamonds. Historically the returns are widely dispersed around the black trend line when Shiller PEs are about 22, as they were January 1, 2013. They range from about -2.5% to +8%. This should be expected for a few reasons: (1) This approach links only one variable (real past earnings average over ten years) to future returns. In reality a myriad of variables, some quantifiable and some not, impact long-term stock returns. (2) Investors are always looking ahead so surprises such as oil embargoes, wars, and speculative bubbles appear as variations from the trend line and (3) Starting and ending dates have an impact on real returns.
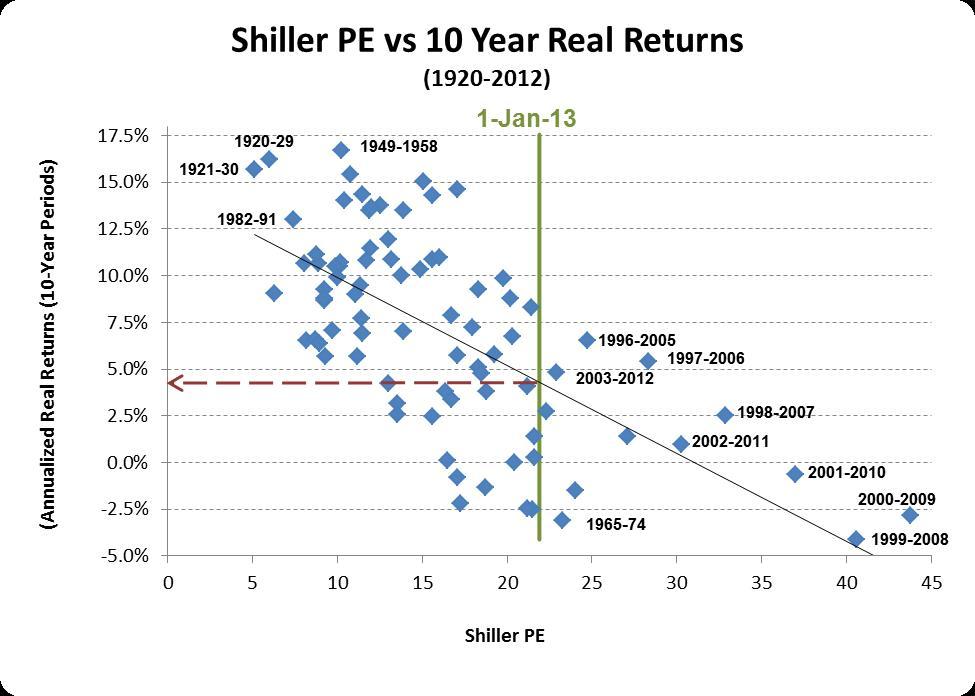
Sources: ONLINE DATA ROBERT SHILLER, Granite Hill Capital calculations
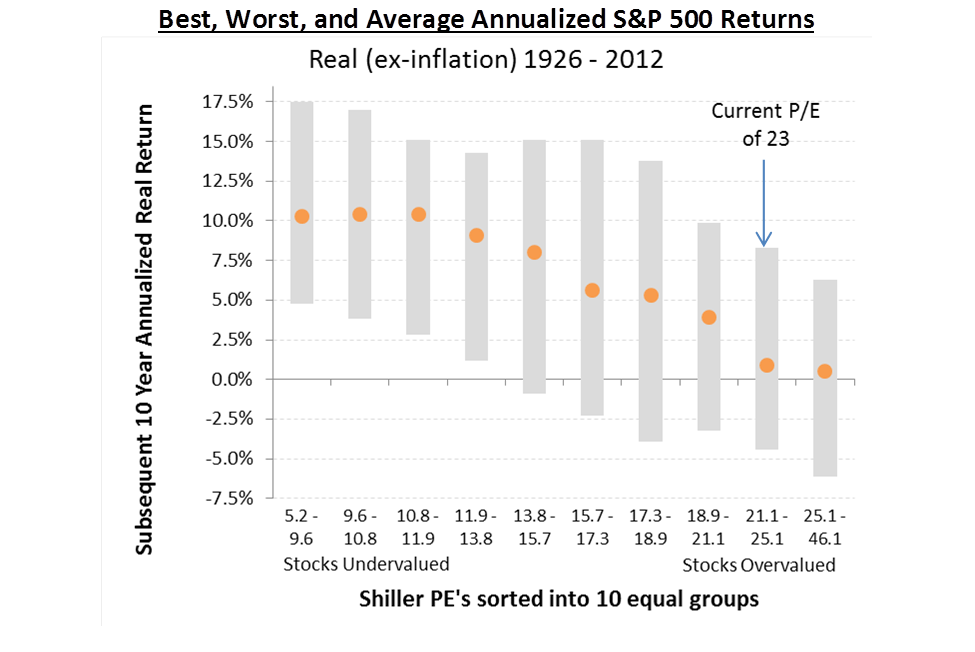
A sobering refinement. Cliff Asness, of AQR Capital Management, concluded real returns would be 0.8% annualized using theShiller PE of 22 last November. His refinement, described in “An Old Friend: The Stock Market’s Shiller P/E” honed in on performance of Shiller PEs by group. As the graph below shows, when Shiller PEs were below 11.9, real returns averaged more than 10% for the next ten years as illustrated in the three left bars. In contrast, when they exceeded 21.1 in the two right bars at the right side, real returns were near zero.
Should I adjust my stock holdings for these forecasts? After receiving a taste of one way analysts go about forecasting future expected returns, this is the real question for investors: What should you do with today’s indication that future stock returns may (or may not) be on the lower side?
As the S&P 500 stock prices have more than recovered from the financial crisis of 2008/09, you may feel like boosting your stock allocation now, especially since interest rates are so low. Reaching for short-term returns can bring poisonous results. The patience, diversification, and risk management takeaways from “Low Interest Rates Got You Down? Performance Differences Between Stocks and Bonds” still apply. A plan which reflects the possibilities for lower long-term US stock returns seems prudent. Saving more, working longer, reassessing spending plans—albeit unpalatable—may be more realistic, particularly for those with either the need or desire to minimize financial risk in their lives.
With any forecast, and particularly those that are optimistic,
“… we should consider not only the probabilities of being wrong, but the consequences as well.” – Kenneth L. Fisher and Meir Statman, “Cognitive Biases in Market Forecasts,” The Journal of Portfolio Management, Fall 2000
[Photo credit for Stocks crystal ball: adapted from Flickr user Mike Licht, NotionsCapital.com]
This blog entry is distributed for educational purposes and should not be considered tax, investment or financial advice. Investment decisions should be based on your personal financial situation. Statements of future expectations, estimates or projections, and other forward-looking statements are based on available information believed to be reliable, but the accuracy of such information cannot be guaranteed. These statements are based on assumptions that may involve known and unknown risks and uncertainties. Past performance is not indicative of future results and no representation is made that the stated results will be replicated. Indexes are not available for direct investment. Their performance does not reflect the expenses associated with the management of an actual portfolio. Indexes reveal positive and negative performance over time. Because the size and variety of stocks and bonds in the marketplace is so large, indexes are used as models to depict, or simulate, the performance of selected groups or asset classes composed of stocks or bonds. Copyright © 2013, Granite Hill Capital Management, LLC.
Links to third party web sites are provided as a convenience and do not imply an affiliation, endorsement, approval, verification or monitoring by Granite Hill Capital Management LLC of any information contained therein. The terms, conditions and privacy policy of linked third party site may differ from this website.
This blog entry is distributed for educational purposes and should not be considered investment, financial, or tax advice. Investment decisions should be based on your personal financial situation. Statements of future expectations, estimates or projections, and other forward-looking statements are based on available information believed to be reliable, but the accuracy of such information cannot be guaranteed. These statements are based on assumptions that may involve known and unknown risks and uncertainties. Past performance is not indicative of future results and no representation is made that any stated results will be replicated. Indexes are not available for direct investment. Their performance does not reflect the expenses associated with the management of an actual portfolio.
Links to third-party websites are provided as a convenience and do not imply an affiliation, endorsement, approval, verification or monitoring by Granite Hill Capital Management, LLC of any information contained therein. The terms, conditions and privacy policy of linked third-party sites may differ from those of this website.


