Costs matter. Whether buying a car or selecting an investment strategy, costs are likely to be an important factor. When you buy a car, for example, the sticker price tells you approximately how much you can expect to pay. But the sticker price is only one part of the overall cost of owning a car. Sales taxes, insurance, routine maintenance costs, and the potential cost of unexpected repairs are also important. When investing in mutual funds, less familiar investment costs need to be considered for evaluating the overall cost effectiveness of a strategy.
Funds with High Expense ratios tend to underperform
Similar to the sticker price of a car, the expense ratio provides information on the cost of an investment strategy. The expense ratio reflects annual fund management, administration, and marketing costs. It is measured against the fund’s assets managed.
Stock funds, run by stock pickers, with higher expense ratios tend to perform worse than those with lower expense ratios. Only 9% of the highest-cost funds outperformed their benchmarks as the chart below illustrates. In contrast, 28% of the lowest-cost stock funds outperformed their benchmarks.
Benchmarks are indexes reflecting the performance of similar assets. They bear no costs so outperforming them is a challenge. But, stock-picking fund managers contend they can outperform because of their skill and experience.
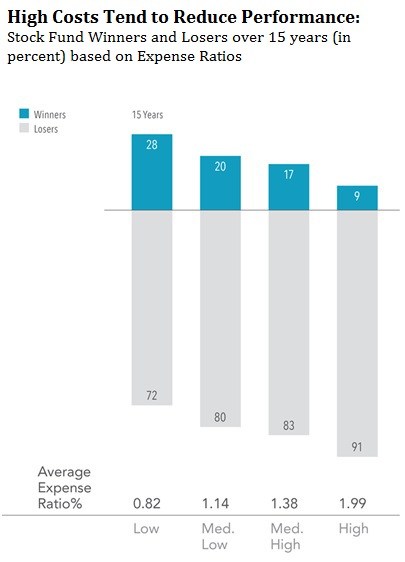
The sample includes funds at the beginning of the 15-year period ending December 31, 2016. Funds are sorted into quartiles within their category based on average expense ratio over the sample period. The chart shows the percentage of winner and loser funds by expense ratio quartile; winners are funds that survived and outperformed their respective Morningstar category benchmark, and losers are funds that either did not survive or did not outperform their respective Morningstar category benchmark. US-domiciled open-end mutual fund data is from Morningstar and Center for Research in Security Prices (CRSP) from the University of Chicago. Equity fund sample includes the Morningstar historical categories: Diversified Emerging Markets, Europe Stock, Foreign Large Blend, Foreign Large Growth, Foreign Large Value, Foreign Small/Mid Blend, Foreign Small/Mid Growth, Foreign Small/Mid Value, Japan Stock, Large Blend, Large Growth, Large Value, Mid-Cap Blend, Mid-Cap Value, Miscellaneous Region, Pacific/Asia ex-Japan Stock, Small Blend, Small Growth, Small Value, and World Stock. For additional information regarding the Morningstar historical categories, please see “The Morningstar Category Classifications” at morningstardirect.morningstar.com/clientcomm/Morningstar_Categories_US_April_2016.pdf. Index funds and fund-of-funds are excluded from the sample. The return, expense ratio, and turnover for funds with multiple share classes are taken as the asset-weighted average of the individual share class observations. For additional methodology, please refer to Mutual Fund Landscape2017 Report DataAppendix in Investment Lessons from 2017 Mutual Fund Landscape Report. Past performance is no guarantee of future results.
Expense ratio wealth Impact
From your point of view as an investor, the 0.5% difference between an expense ratio of 0.25% vs. 0.75% means savings of $5,000 per year on a $1 million account. Over longer periods, these dollars can add up as the graph below illustrates.
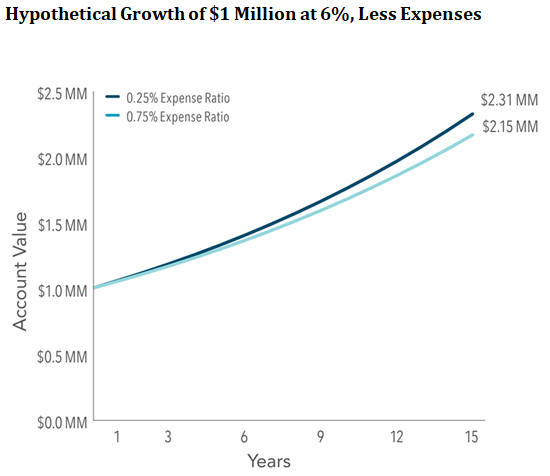
For illustrative purposes only and not representative of an actual investment. This hypothetical illustration is intended to show the potential impact of higher expense ratios and does not represent any investor’s actual experience. Assumes a starting account balance of $1,000,000 and a 6% compound annual growth rate less expense ratios of 0.25% and 0.75% applied over a 15-year time horizon. Taxes and other potential costs are not reflected. Actual results may vary significantly. Changing the assumptions would result in different outcomes. For example, the savings and difference between the ending account balances would be lower if the starting investment amount was lower.
Look at other investment costs
What matters most when gauging the true cost effectiveness of an investment strategy is the “total cost of ownership.” It more holistically looks at observable costs, like expense ratios, but also costs more difficult to assess, like trading costs and tax impact.
Trading costs are opaque
Overall fund trading costs are a function of the amount of trading, or turnover, and the cost of each trade. If a fund manager trades excessively, costs like commissions and the price impact from trading can eat away at returns. Viewed through the lens of our car analogy, this impact is like jamming your brakes or accelerating quickly. By driving like this when it may not be necessary, the more wear and tear your car is likely to experience and the more fuel you will end up using. These actions can increase the total cost of ownership.
Trading costs are surprisingly high
“Shedding Light on ‘Invisible’ Costs: Trading Costs and Mutual Fund Performance,” published in the January/February 2013 Financial Analysts Journal, found trading costs were 1.44 percent (in aggregate). They exceeded the average expense ratio of 1.19 percent. According to the article abstract, “The authors found that funds’ annual trading costs are, on average, higher than their expense ratio and negatively affect performance.”
Taxes exact a costly impact
Some funds aim purely for performance. They ignore the difference between long and short-term capital gains taxes and may distribute higher short-term capital gains. Other funds are managed to minimize unnecessary realized taxes. They strive to avoid short-term capital gains and invest in stocks that pay only qualified dividends that are taxed at a lower rate.
You can further manage taxes by “locating” your assets between your taxable and tax-deferred (401k and/or traditional IRA) or exempt (Roth) accounts. We discuss this in Asset Location, where investments are placed, can reduce taxes.
Take charge of your total cost of ownership
So what are some of the steps we recommend for wisely managing your investment costs?
-
- Seek funds with low expense ratios for the category in which they compete.Also, understand that the lowest may not be best. For example, some funds lend stocks in their portfolios and share the compensation for doing so with fund holders. The results appear in better performance, not costs.
- Research your fund manager’s trading skills. As described above, high trading costs show up in diminished performance, not a fund’s fees. Cost-effective trading takes a scientific approach. When stock pickers are desperate to buy or sell, it provides liquidity. It also allows the well-documented tendency of price momentum, where stocks drift in one direction to play out instead of jumping in front of it. One fund company that focuses on cost-effective trading is Dimensional Fund Advisors (DFA). Their trading contributes to the superior results shown in DFA’s “Relative Performance of Stock Funds With More Than 15 Years of History.”
- Avoid “12b-1 fees” and funds with sales or load charges. These hidden costs are marketing or distribution fees often used to compensate salespeople for recommending the fund to you. They reduce the fund’s underlying performance.
- Be careful in assuming Exchange Traded Funds (ETF’s) have low total costs. Even though many have low management costs, may be purchased commission free, and are less likely to distribute capital gains, there are other costs. There can be a costly spread between purchase and selling prices, or “bid-ask.” Furthermore, Inefficiencies in the Pricing of Exchange-Traded Funds published in the First Quarter 2017 Financial Analysts Journal found “ETFs routinely exhibits some economically significant differences between the ETF share price and the value of the underlying portfolio… indicating that the unsophisticated investor may face an unexpected additional cost when trading ETFs.” Specifically, the author calculated that the cumulative cost difference between ETF share price and underlying value totaled $41 billion a year when the entire ETF industry is estimated to earn $6 billion in management fees.
- Be your own best champion. The best fund manager in the world cannot save you from yourself. You must also avoid self-inflicted wounds. Trading too frequently, overreacting to market fluctuations and failing to account for tax implications can reduce performance. Managing your own portfolio requires time for research and due diligence, knowledge to build a deliberate plan to meet your goals and discipline to stick with a tax-efficient portfolio through thick and thin. It is neither quick nor easy.
If you are interested in managing total cost of an investment strategy and need help, we offer a complimentary analysis of your current portfolio. We review what you are currently paying, how your costs compare to appropriate benchmarks and where there is room for improvement. If you would like to receive our objective a second-opinion on your current portfolio, please call or email.
Source: Adapted from Dimensional Fund Advisors LP, “Getting What You Don’t Pay For.”
This blog entry is distributed for educational purposes and should not be considered investment, financial, or tax advice. Investment decisions should be based on your personal financial situation. Statements of future expectations, estimates or projections, and other forward-looking statements are based on available information believed to be reliable, but the accuracy of such information cannot be guaranteed. These statements are based on assumptions that may involve known and unknown risks and uncertainties. Past performance is not indicative of future results and no representation is made that any stated results will be replicated. Indexes are not available for direct investment. Their performance does not reflect the expenses associated with the management of an actual portfolio. Copyright © 2019, Granite Hill Capital Management, LLC.
Links to third-party websites are provided as a convenience and do not imply an affiliation, endorsement, approval, verification or monitoring by Granite Hill Capital Management, LLC of any information contained therein. The terms, conditions and privacy policy of linked third-party sites may differ from those of this website.
This blog entry is distributed for educational purposes and should not be considered investment, financial, or tax advice. Investment decisions should be based on your personal financial situation. Statements of future expectations, estimates or projections, and other forward-looking statements are based on available information believed to be reliable, but the accuracy of such information cannot be guaranteed. These statements are based on assumptions that may involve known and unknown risks and uncertainties. Past performance is not indicative of future results and no representation is made that any stated results will be replicated. Indexes are not available for direct investment. Their performance does not reflect the expenses associated with the management of an actual portfolio.
Links to third-party websites are provided as a convenience and do not imply an affiliation, endorsement, approval, verification or monitoring by Granite Hill Capital Management, LLC of any information contained therein. The terms, conditions and privacy policy of linked third-party sites may differ from those of this website.


